How Times Change
It all seems very bizarre. I was born in 1973, so three ubiquitous kid fears were subconsciously ingrained into my adolescent and adult subconscious. One is an irrational feeling of alarm at the sight of nuclear power plant cooling towers (Three Mile Island accident in 1979). Another is the omnipresent threat that the world will be spontaneously obliterated by global thermonuclear war (the arms race between the US and USSR (the latter acronym still evokes a different time) with the Sunday evening in November 1983 spent watching The Day After along with the rest of the country on ABC serving as the cherry on top – uplifting stuff!). And the third was the understanding that Iran was a formidable enemy to be feared and reckoned with from an area of the world in the Middle East that could really make our lives difficult here in the United States (waiting in line on the highway to get gasoline during what I now know to be the Oil Embargo of 1979 with parody songs like Ayatollah by Steve Dahl (based on My Sharona from The Knack) and Bomb Iran by Vince Vance & The Valiants (based on Barbara Ann by the Beach Boys) playing on the FM dial in the car between updates on the Iran Hostage Crisis). So, following the news in recent days where the Israel/US bombing is seemingly bringing Iran to its knees with sympathizers to the regime largely muted is somewhat surreal to watch. Moreover, the fact that the situation is not only not spawning nighttime news shows (Ted Koppel, where are you now?), but the above the now virtual newspaper fold headlines are being shared with AI’s Biggest Threat: Young People Who Can’t Think shows how times and sentiments have dramatically changed over the last half century.
Amid this bizarrely serene backdrop as geopolitical events continue to unfold, it is worthwhile to take a broad look across asset classes to see how the global stock market landscape is responding.
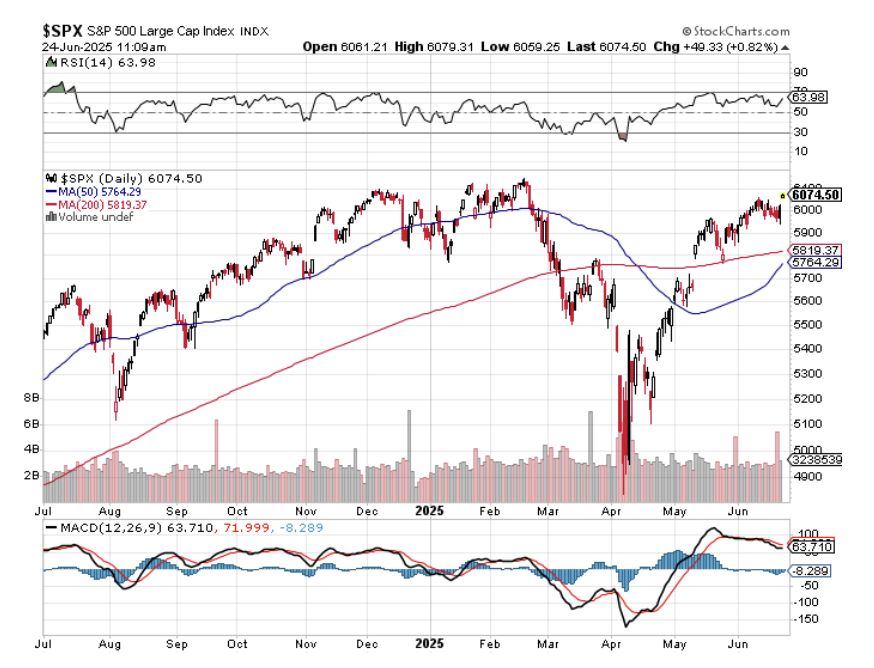
U.S. stocks. Bombing in the Middle East? What bombing in the Middle East? Make an announcement about imposing unexpectedly high tariffs on our global trading partners, and markets go nuts. Dismantle the nuclear apparatus of a global military foe – whatevs. Has the S&P 500 been grinding lower the last few trading days after peaking at 6059 the Wednesday before last? Sure, but stocks had a far bigger reaction to questions about the U.S. fiscal budget back in May versus what we are seeing today. If anything, today’s U.S. stock market looks like one methodically working its way through a healthy consolidation following a strong rally since early April and gearing up for setting new all-time highs by the time 2025 Q2 earnings season gets started in July.
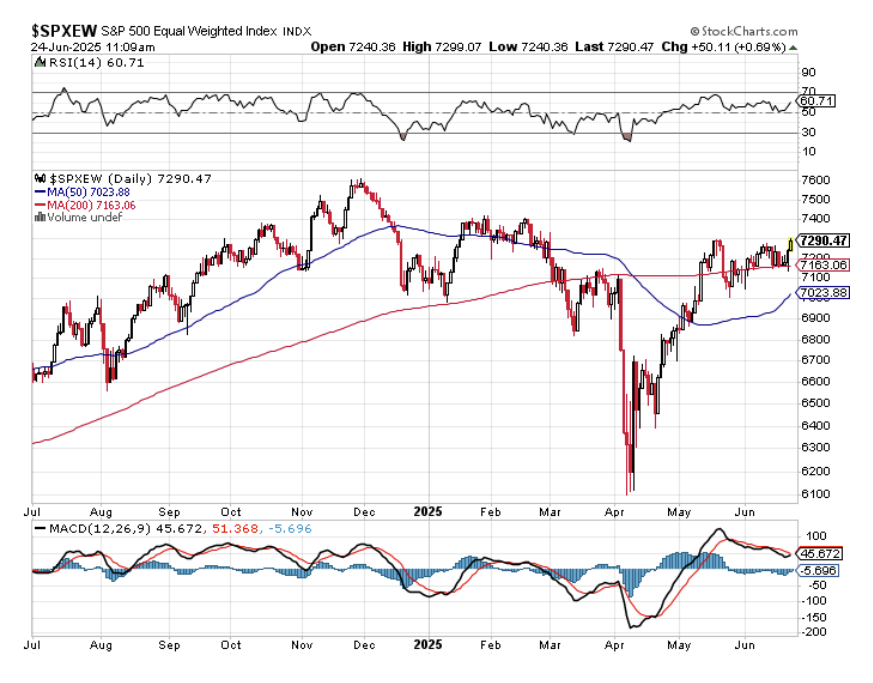
But let’s keep going, as the S&P 500 often obscures what is going on with the markets underneath the surface. Let’s begin with a look at the S&P 500 Equal Weighted Index, which looks at all 503 companies in the S&P 500 at the same percentage allocation. A little less rosy but still rock solid. Indeed, we are still trading below the all-time highs from last Thanksgiving, but we have reclaimed upward sloping long term 200-day moving average support (red line in the chart below). And the Relative Strength Index (RSI) is still holding in bullish territory with a current reading at just over 55. Once again, this is an index that appears to be gearing up for its next move to the upside.
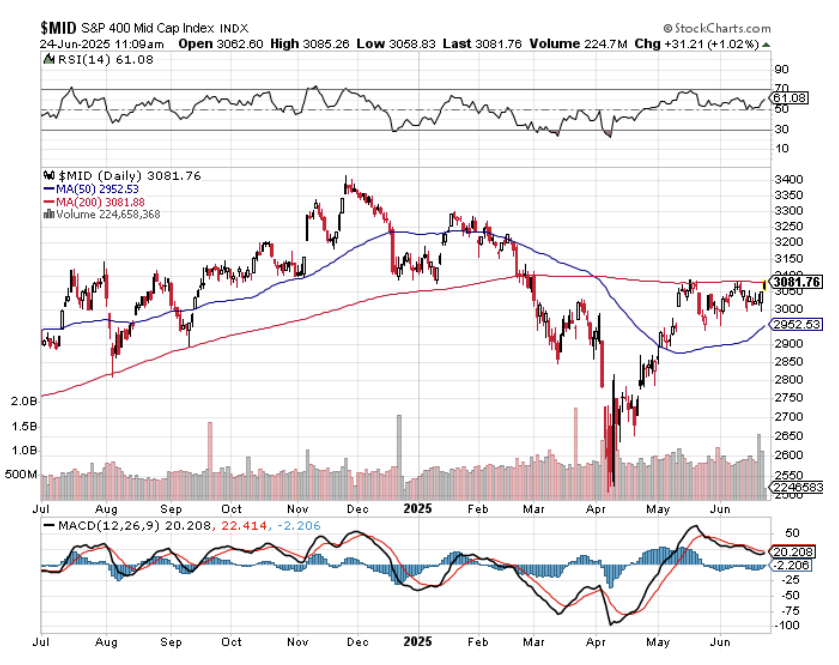
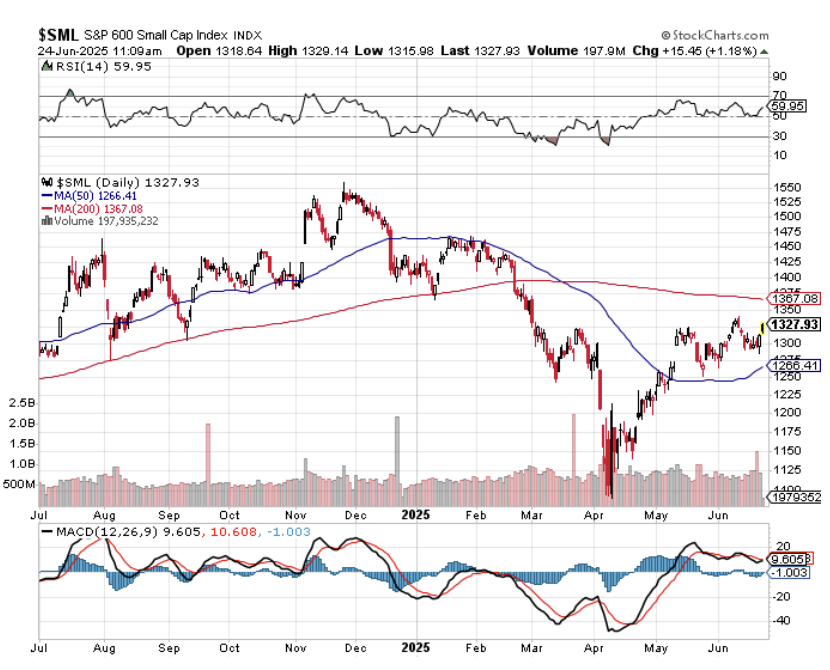
Let’s take a look at mid-caps and small caps. Indeed, how times have changed when it comes to these areas of the market as well. It was not long ago in a pre-Great Financial Crisis world where mid-caps and in particular small caps were leading indicators of the eventual direction of large caps. Those days are long over outside of fleeting moments, but they still provide useful coincident indicators of the “reality” of market health outside of what the Mag 7 and friends may be doing at any given point in time. Referring to the charts below, we see a similar albeit more pronounced trend being presented by equal weighted large caps. Both mid-caps and small caps are still trading well below Thanksgiving era highs, and both are still battling key technical resistance levels.
For mid-caps, resistance is the flattish 200-day moving average (red line in the top chart below) but the index enjoys support from the ultra-long term 400-day moving average (pink line in the top chart below), a combination implying that mid-caps are likely to eventually break out to the upside and confirmed with the RSI holding above 50. Battling, but bullish.
As for small caps, a bit more challenged still, but grinding in the right direction. Here the index needs to overcome resistance at both its still upward sloping (good) ultra long term 400-day moving average and now downward sloping (not so good) long-term 200-day moving average, which are no small tasks to overcome. But recent trends remain constructive.
Putting this all together, the U.S. stock market remains strong despite the 2025 headlines that is still top heavy with the biggest names leading the way. The smaller the stock as measured by market cap, the more challenging and bumpier the road ahead all else equal.
International stocks. Arguably one of the most attractive upside opportunities over the next 12-24 months is investing in markets outside of the U.S. And this is despite the geopolitical uncertainties playing out around the world.
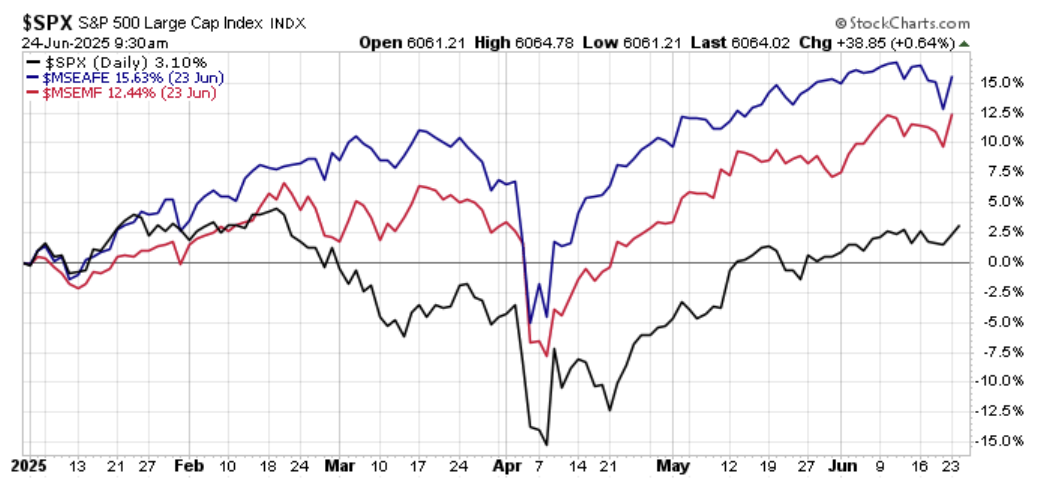
Wait a second. Haven’t U.S. markets been crushing both developed international and emerging markets on a cumulative return basis over the last 15 years? Yeah, non-U.S. markets have handily outperformed U.S. stocks so far in 2025 (see below), but didn’t we see the same thing coming out of the COVID crisis from May 2020 through February 2021, only to see U.S. stocks reclaim the throne?
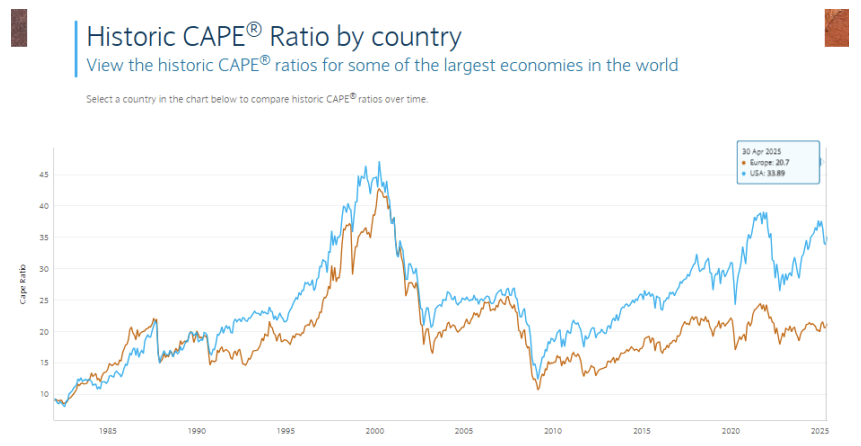
And isn’t the side of the investment highway over the past decade littered with analysts proclaiming the historically attractive relative value of non-U.S. Stocks versus the U.S. only to see this relative valuation become even more attractive?
All of these things are indeed true. But here’s a few reasons beyond more attractive valuations and higher dividend yields why the long overdue rotation back to non-U.S. stocks might actually stick going forward.
First, many major economies outside of the U.S. are not only in the earlier stages of their economic and earnings growth cycles, but they are also more focused on commodity-rich and manufacturing heavy business activities that stand to benefit from increased global infrastructure spending, disglobalization if not outright deglobalization, and stickier inflation pressures going forward.
Also, the attractive interest rate differentials that once existed between the U.S. and the likes of Japan, the UK, Germany, and developed countries across the European Union throughout the 2010s have since neutralized, and non-U.S. countries arguably have more monetary policy flexibility for more sustained accommodative policy relative to the U.S. going forward.
Next, recent policy initiatives from the U.S. have altered the perception of the U.S. being the global destination for safe haven and capital protection bar none.
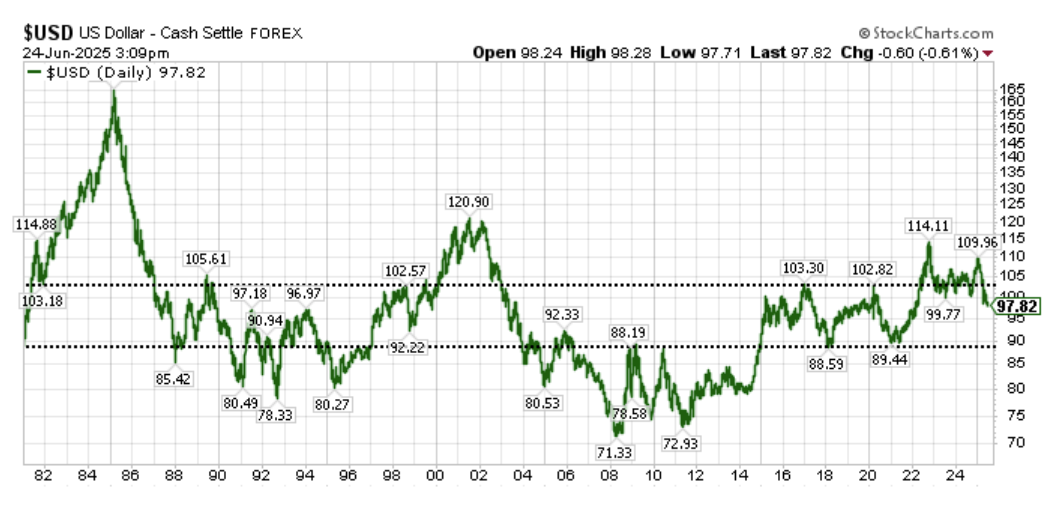
Lastly and arguably most importantly, we are emerging from a period dating back non-coincidentally to the immediate aftermath of the Great Financial Crisis where the U.S. dollar has gone from more than two standard deviations weak relative to global currencies to more than two standard deviations strong relative to global currencies. If you want a massive tailwind to drive U.S. stock outperformance relative to non-U.S., this alone will go a very long way of doing it. But just as we saw from the mid-1980s through the mid-1990s (international stocks meaningfully outperformed the U.S.) and during the 2000s (once again, international stocks led U.S. stocks), global currencies move in long-term secular cycles relative to one another. And the case can be made that we are on the precipice of a new prolonged phase of U.S. dollar weakness relative to the rest of the world.
Bottom line. It has been a surreal time monitoring the events across the world in recent months. But despite all of the geopolitical winds of change that continue to blow, global investment markets remain steady and full of upside opportunities. Next week, we’ll settle in to discuss the 2025 Second Half Outlook.
Disclosure: I/we have no stock, option or similar derivative position in any of the companies mentioned, and no plans to initiate any such positions within the next 72 hours. I wrote this article myself, and it expresses my own opinions. I am not receiving compensation for it. I have no business relationship with any company whose stock is mentioned in this article.
Investment advice offered through Great Valley Advisor Group (GVA), a Registered Investment Advisor. I am solely an investment advisor representative of Great Valley Advisor Group, and not affiliated with LPL Financial. Any opinions or views expressed by me are not those of LPL Financial. This is not intended to be used as tax or legal advice. All performance referenced is historical and is no guarantee of future results. All indices are unmanaged and may not be invested into directly. Please consult a tax or legal professional for specific information and advice.
LPL Compliance Tracking #: 759200

